
This year we are learning how to make graphs. We have been learning all about statistics in maths.
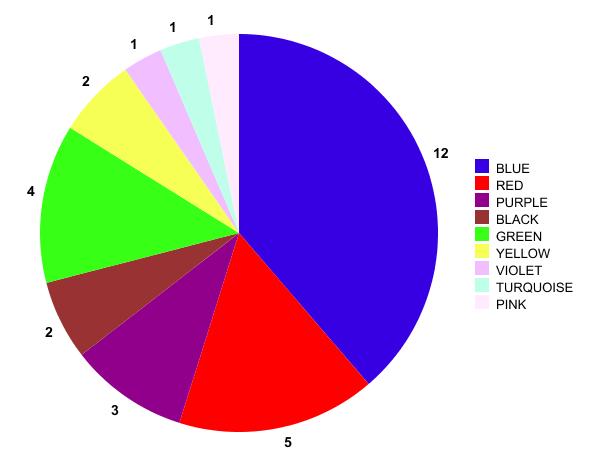
Room 21 wanted to find out what peoples favourite colours, sports, t.v. programme, animal and fast food were. My bar graph and pie chart show what peoples favourite colours were. Most people liked blue.
No comments:
Post a Comment
Note: Only a member of this blog may post a comment.